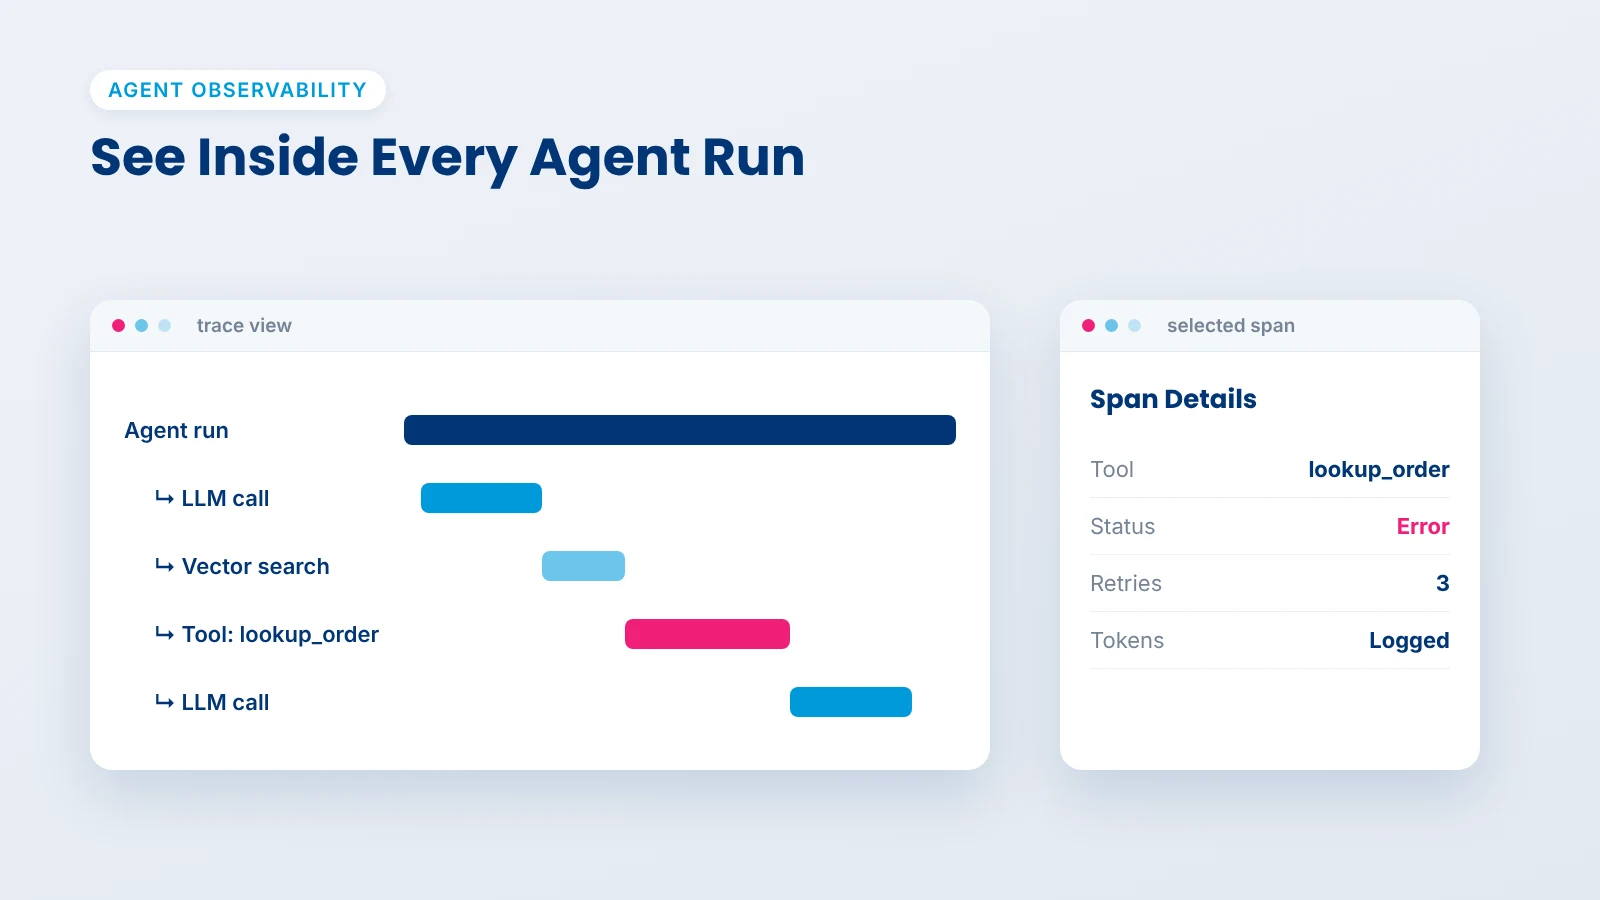
Traditional APM sees a request go in and a response come out. Agents fail in the steps between, so you need step-level traces.
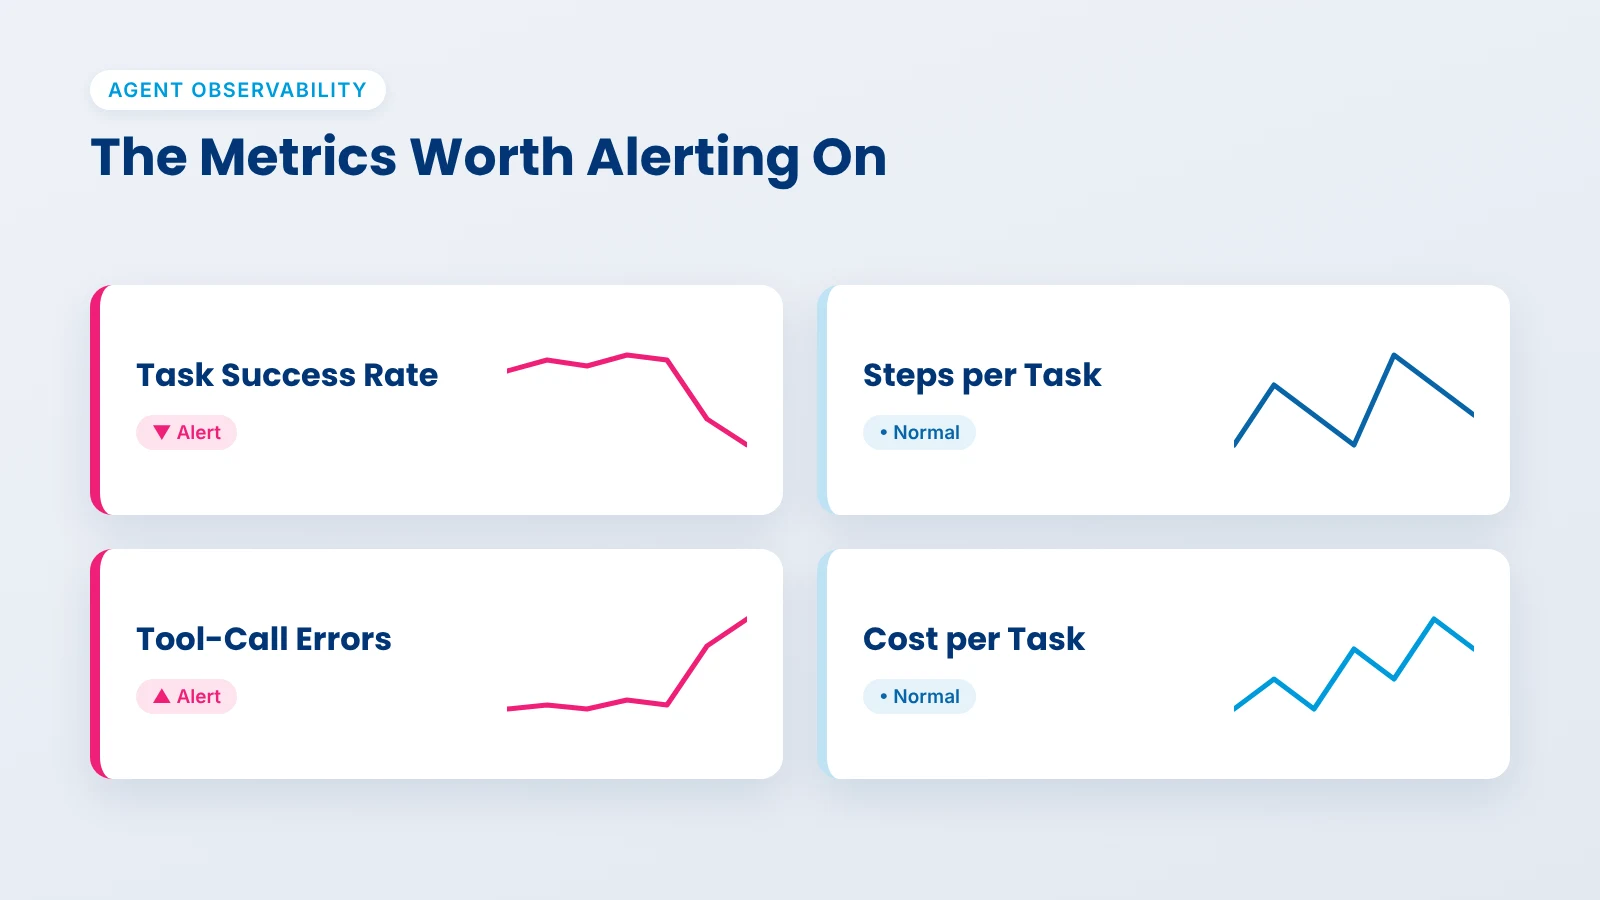
Track task outcomes, not only system health: task success rate, steps per task, tool-call errors and human escalations matter as much as latency.
Instrument with OpenTelemetry’s GenAI conventions so your traces are not locked to one vendor.
Pick tools by constraint: data residency, framework, existing monitoring stack and budget model.
Start small: trace one agent end to end, set a baseline for two weeks, then add alerts.
What is AI agent observability, and why isn’t APM enough?
AI agent observability means capturing an agent’s full decision path, so an engineer can replay any run and see what the agent saw, decided and did at each step. Application performance monitoring (APM) was built for deterministic code, where the same input takes the same path. Agents do not work that way.
An agent can return a fluent answer while having called the wrong tool, retried a failing API six times, or pulled an outdated document. Every HTTP call succeeded, so APM shows green. The failure only appears when you look at the reasoning and actions in between.
That gap is why AI agent monitoring needs three things APM does not give you:
Step-level context: the prompt, retrieved context, tool arguments and output for each step, linked into one run.
Quality signals: whether the task was actually completed, not just whether the service responded.
Cost per outcome: tokens and tool calls add up per task, and a looping agent can burn budget quietly.
Observability tells you what happened. Evaluation grades whether it was right. Both matter, and this post focuses on the first. For the second, see our guide to AI agent testing and evaluation.
What should you capture? Traces, spans and sessions
Capture each agent run as one trace, with a span for every model call, tool call, retrieval and handoff, and group traces into sessions for multi-turn conversations. That structure is what lets you answer which step broke.
Trace: one complete agent run, from user request to final answer.
Span: one step inside it, such as an LLM call, a tool execution or a vector search. Spans nest, so a sub-agent’s work sits under the agent that called it.
Session: a group of traces from one conversation or user, so you can follow a problem across turns.
Attributes on each span: model name, input and output tokens, latency, tool name, arguments, status and errors.
Use OpenTelemetry’s GenAI conventions
OpenTelemetry now defines a shared vocabulary for this under the gen_ai.* namespace, including agent operations such as invoke_agent and execute_tool. These GenAI semantic conventions now live in their own repository, so they can be versioned separately from the core OpenTelemetry spec.
One caution from practice: the agent conventions are still marked Development, so attribute names can change between releases. Pin your instrumentation library versions and upgrade on purpose.
Here is a minimal Python example of manual instrumentation for an agent run with one tool call. Most frameworks can do this automatically, but seeing the shape helps when you debug.
from opentelemetry import trace

tracer = trace.get_tracer("support-agent")

def handle_request(user_query: str) -> str:
    with tracer.start_as_current_span("invoke_agent support_agent") as agent_span:
        agent_span.set_attribute("gen_ai.operation.name", "invoke_agent")
        agent_span.set_attribute("gen_ai.agent.name", "support_agent")

        with tracer.start_as_current_span("chat") as llm_span:
            llm_span.set_attribute("gen_ai.operation.name", "chat")
            llm_span.set_attribute("gen_ai.request.model", MODEL_NAME)
            plan = call_model(user_query)
            llm_span.set_attribute("gen_ai.usage.input_tokens", plan.input_tokens)
            llm_span.set_attribute("gen_ai.usage.output_tokens", plan.output_tokens)

        with tracer.start_as_current_span("execute_tool lookup_order") as tool_span:
            tool_span.set_attribute("gen_ai.operation.name", "execute_tool")
            tool_span.set_attribute("gen_ai.tool.name", "lookup_order")
            try:
                result = lookup_order(plan.order_id)
            except Exception as err:
                tool_span.record_exception(err)
                tool_span.set_status(trace.StatusCode.ERROR)
                raise

        return compose_answer(result)
In the OpenTelemetry project’s GenAI instrumentation, capturing full prompt and response content is something you switch on, while metadata such as model, token counts and durations is recorded as standard. Turn on full content capture in staging, and in production only with PII redaction in place.
Which AI agent observability metrics actually matter?
The metrics that matter measure whether the agent finished the job, how it got there and what it cost. Group them into outcome, behavior, performance and cost, and alert on change from your own baseline rather than on fixed industry numbers.
The alert triggers below are starting points we suggest, not benchmarks. Run for two weeks, record your baseline, then tune.
Metric
What it tells you
Suggested starting alert
Task success rate
Share of runs that completed the user’s goal, judged by an evaluator or user feedback
Drops 5 points or more below the 7-day baseline
Human escalation rate
How often the agent hands off to a person
Rises 50% or more above baseline
Steps per task
Reasoning efficiency; a sudden rise often means loops or confusion
p95 doubles, or any run exceeds your hard step cap
Tool-call error rate
Failed or invalid tool calls, wrong arguments, timeouts
Above 2% for any single tool over 15 minutes
Retries per run
Hidden instability that success rates can mask
Average climbs above 1 per run
End-to-end latency (p50, p95)
User experience across the whole run, not one model call
p95 exceeds your product’s latency budget
Time to first token
Perceived speed for streaming answers
Above your UX target for 10 minutes
Tokens and cost per task
Spend per completed outcome; catches prompt bloat and loops
Rises 30% or more week over week
Groundedness or faithfulness score
Whether answers stick to retrieved or tool data
Falls below the threshold set in your eval suite
Two habits make these numbers useful. First, measure per agent and per tool, not one blended figure, because an average hides the one tool that is failing. Second, link cost to outcomes: cost per successful task tells a CFO far more than total tokens.
Running AI agents in production?
Talk to Xicom’s AI engineers about tracing, metrics and alerts built into your agent from day one.
How do the main agent observability tools compare?
Most teams choose between four agent observability tools: LangSmith, Langfuse, Arize Phoenix and Datadog LLM Observability. All of them trace agent runs well. The real differences are hosting, licensing, framework fit and how they bill.
Companies already on Datadog that want agent traces next to APM, infrastructure and user data
Billed on LLM spans ingested, so one agent run can create several billable spans
How to choose
Data cannot leave your environment: start with self-hosted Langfuse or Phoenix. LangSmith fits if an enterprise contract is acceptable.
You are already on Datadog: use its LLM Observability, so an agent issue and the slow database behind it sit in one trace.
Your agents run on LangGraph: LangSmith gives the lowest setup effort.
You want to keep your options open: instrument with OpenTelemetry first. Datadog, for example, natively supports the OpenTelemetry GenAI conventions from v1.37 onward, and Phoenix is built on OpenTelemetry, so switching backends later is a configuration change, not a rewrite.
What are the most common agent observability mistakes?
Most agent observability problems come from tracing too little, too late or without context. These are the ones we see most often when teams move agents from pilot to production.
Tracing only the model call. Teams log the LLM request and miss the tool calls and retrievals around it. Most agent failures start in a tool or in retrieved data, so trace every step.
No link between steps. Logs from the agent, the tools and the backend services sit in different systems with no shared trace ID. Propagate trace context across every hop, including sub-agents and MCP servers.
Logging full prompts with customer data. It feels useful until a security review finds names and account numbers in the trace store. Redact PII before export and set retention limits.
Alerting on averages. A 1% overall error rate can hide one tool that fails 20% of the time. Break metrics down per tool and per agent.
No step cap. An agent stuck in a loop keeps spending until someone notices. Set a maximum step count per run and alert when runs hit it.
Never closing the loop. Traces that nobody reviews are just storage. Turn bad production runs into test cases for your evaluation suite every week.
Agent observability rollout checklist
Roll out agent observability in four short phases: instrument one agent, baseline it, alert on it, then make review a habit. Copy this list into your sprint board.
Week 1: Instrument
Pick one production agent with real traffic
Add OpenTelemetry GenAI instrumentation (framework auto-instrumentation where it exists)
Confirm every model call, tool call and retrieval appears as a span under one trace
Propagate trace IDs to downstream services and sub-agents
Turn on PII redaction before any content capture
Weeks 2 to 3: Baseline
Record task success, steps per task, tool errors, latency and cost per task
Tag runs with agent version and prompt version
Sample runs daily and label a few by hand to check your success measure
Week 4: Alert
Set alerts on change from baseline, per agent and per tool
Add a hard step cap and a per-run cost cap
Route alerts to the team that owns the agent, with a link to the failing trace
Ongoing: Review and improve
Hold a weekly 30-minute trace review of the worst runs
Add each new failure pattern to the evaluation suite
Re-baseline after every model, prompt or tool change
How Xicom approaches AI agent observability
We treat observability as part of the build, not a tool added after launch. When our team develops an agent, tracing goes in during the first sprint, using OpenTelemetry so clients are free to choose or change their backend. We agree on what task success means with the business owner before go-live, because that definition drives every alert that follows. After launch, we run a short baseline period, set alerts on change from that baseline, and review failing traces with the client’s team each week.
Xicom has 150+ AI engineers and data scientists, and our ISO/IEC 42001 certification for AI management systems shapes how we handle logging, retention and access to trace data.
What is the difference between AI agent observability and AI agent monitoring?
Monitoring watches known signals, such as latency, error rates and cost, and alerts when they cross a line. Observability records enough detail about each run, including prompts, tool calls and retrieved data, that you can investigate problems you did not predict. In practice, teams need both: monitoring tells you something is wrong, and observability tells you why.
How is LLM tracing different from agent tracing?
LLM tracing records a single model call: the prompt, response, tokens and latency. Agent tracing connects many of those calls with the tool executions, retrievals and handoffs between them into one run. An agent can make a dozen model calls for one task, so you need the full chain to see where a decision went wrong.
Does adding observability slow down an AI agent?
Good instrumentation adds very little delay because spans are batched and exported in the background, not sent on every step. The bigger risk is cost and storage when you capture full prompts and responses at high volume. Sample verbose content in production and keep full detail for errors and flagged runs.
Which open-source tools can I use for agent observability?
Langfuse, with an MIT-licensed core, and Arize Phoenix, under Elastic License 2.0, are the most common open choices, and both can be self-hosted. OpenTelemetry provides the vendor-neutral instrumentation layer underneath. Check each license against how you plan to use the tool, especially if you offer it to your own customers.
What should I log for compliance and audits?
Log who triggered the run, which agent and prompt versions ran, every tool the agent called with its arguments and result, and any human approval. Redact personal data before storage, set retention limits and restrict who can read traces. These records help you answer audit questions about why an agent took an action.
When should a team set up agent observability?
Before the first real user. Tracing added during the pilot gives you a baseline to compare against when traffic grows, and it shortens debugging from days to minutes. Retrofitting it after an incident is slower and usually happens under pressure.
The Author
Rahul Mahajan
Founder and CEO · Xicom
With over two decades of experience leading technology and business strategy, Rahul Mahajan has shaped the AI and digital transformation direction of enterprises across industries including Healthcare, Retail, FinTech, and Education. Under his leadership as the Founder and CEO of Xicom, the company has scaled to a 350+ member team and delivered 1800+ projects for clients across 50+ countries.
Discover how AI in travel and hospitality improves guest experiences, automates bookings, optimizes hotel operations, and transforms travel management.